Maximizing Profits: How to Utilize a Trading Analytics Platform
5 min read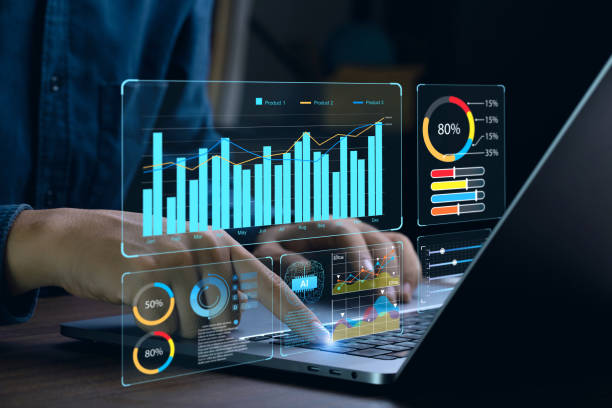
In the fast-paced world of trading, having the right tools can make all the difference between success and failure. One of the most powerful tools available today is the trading analytics platform. These platforms provide traders with crucial insights and data, enabling them to make informed decisions and maximize profits. In this article, we’ll explore how to effectively utilize a trading analytics platform to boost your trading performance.
Understanding Trading Analytics Platforms
What are Trading Analytics Platforms?
Trading analytics platforms are sophisticated software tools that help traders analyze financial markets, develop strategies, and track performance. They aggregate data from various sources, offering comprehensive insights through charts, indicators, and reports.
Key Features of Trading Analytics Platforms
Most trading analytics platforms come equipped with features such as:
- Charting Tools: Visual representations of market data.
- Technical Indicators: Tools like moving averages, RSI, and MACD to analyze price trends.
- Fundamental Analysis Tools: Insights into company performance through financial statements.
- Machine Learning: AI-driven analytics for predicting market movements.
- Backtesting Capabilities: Testing trading strategies against historical data.

Getting Started with a Trading Analytics Platform
Choosing the Right Platform for Your Needs
Selecting the right platform depends on your trading style and goals. Consider factors like user interface, available tools, and data integration capabilities. Popular options include TradingView, MetaTrader, and Thinkorswim.
Setting Up Your Account
Once you’ve chosen a platform, setting up your account is straightforward. Follow the registration process, verify your identity if required, and configure your settings to match your trading preferences.
Data Collection and Integration
Importing Historical Data
Historical data is vital for backtesting and analyzing past market behavior. Most platforms allow you to import data from various sources, ensuring you have a comprehensive dataset to work with.
Connecting Real-Time Data Feeds
Real-time data is crucial for making timely trading decisions. Ensure your platform is connected to reliable data feeds, providing you with up-to-the-minute market information.
Technical Analysis Tools
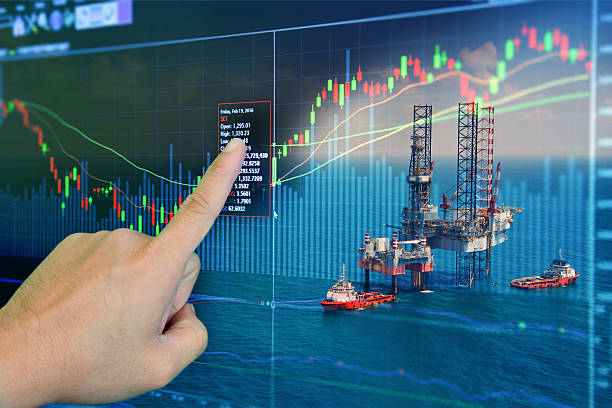
Charting Tools
Charting is the cornerstone of technical analysis. Utilize different types of charts (line, bar, candlestick) to visualize market trends. Customize these charts with technical indicators to gain deeper insights.
Technical Indicators
Indicators like moving averages, Bollinger Bands, and the Relative Strength Index (RSI) can help you identify potential entry and exit points. Experiment with different indicators to find what works best for your trading style.
Fundamental Analysis Tools
Financial Statements Analysis
Reviewing financial statements of companies provides insights into their health and performance. Look at metrics like earnings per share (EPS), revenue, and debt levels to make informed trading decisions.
News and Event Tracking
Market-moving news and events can significantly impact prices. Use your platform’s news feed to stay updated on economic releases, corporate announcements, and geopolitical events.
Customizing Your Dashboard
Setting Up Your Workspace
A well-organized workspace can enhance your trading efficiency. Customize your dashboard by adding relevant widgets and modules that provide quick access to essential information.
Using Widgets and Modules
Widgets can include watchlists, news feeds, and performance summaries. Arrange these elements to create a seamless workflow that suits your trading style.
Creating and Backtesting Trading Strategies
Developing Trading Strategies
Develop trading strategies based on your analysis. Whether you’re a trend follower, a swing trader, or a day trader, having a clear plan is crucial.
The Importance of Backtesting
Backtesting allows you to test your strategies against historical data to evaluate their effectiveness. Refine your strategies based on backtesting results to improve their performance in live markets.
Utilizing Machine Learning and AI
Predictive Analytics
Machine learning algorithms can analyze vast amounts of data to predict future market movements. Use these predictions to enhance your trading strategies.
Algorithmic Trading
Algorithmic trading involves using automated systems to execute trades based on predefined criteria. This can help you take advantage of market opportunities with precision and speed.

Risk Management Features
Setting Stop-Loss and Take-Profit Levels
Risk management is vital for long-term success. Use stop-loss and take-profit levels to protect your investments and lock in profits.
Position Sizing and Portfolio Management
Proper position sizing ensures that you’re not overexposed to any single trade. Diversify your portfolio to spread risk and increase stability.
Monitoring and Alerts
Real-Time Monitoring
Keep an eye on your positions and the overall market in real time. This allows you to react swiftly to changing conditions.
Setting Up Alerts and Notifications
Set alerts for price movements, technical indicators, and news events. Notifications can help you stay informed and make timely decisions.
Performance Analysis and Reporting
Tracking Your Performance
Regularly review your trading performance. Analyze your wins and losses to understand what works and what doesn’t.
Generating Reports
Generate detailed reports to assess your trading activities. Use these insights to refine your strategies and improve your performance.
Continuous Learning and Improvement
Staying Updated with Market Trends
The financial markets are constantly evolving. Stay updated with the latest trends, news, and innovations to keep your strategies relevant.
Learning from Your Trades
Every trade offers a learning opportunity. Analyze your trades to identify mistakes and successes, and use these lessons to enhance your trading skills.

Common Mistakes to Avoid
Over-Reliance on Analytics
While analytics are powerful, relying solely on them can be risky. Always consider market fundamentals and other factors.
Ignoring Market Fundamentals
Technical analysis is important, but don’t ignore fundamentals. Economic indicators, company performance, and geopolitical events can all impact the market.
FAQs
What is the best trading analytics platform?
The best platform depends on your needs. Popular choices include TradingView, MetaTrader, and Thinkorswim.
How much does a trading analytics platform cost?
Costs vary widely, from free basic versions to premium subscriptions costing several hundred dollars per month.
Can beginners use trading analytics platforms?
Yes, many platforms are user-friendly and offer resources to help beginners get started.
What data is most important for trading analysis?
Key data includes price trends, volume, financial statements, and news events.
How often should I update my trading strategies?
Regular updates are crucial. Review and adjust your strategies based on market changes and performance analysis.
Conclusion
Trading analytics platforms and trading signals platforms are invaluable tools for modern traders. By understanding how to use these platforms effectively, you can gain a competitive edge, make informed decisions, and maximize your profits. Start exploring a trading analytics platform or a trading signals platform today and take your trading to the next level.